

Strategies built on
who knows more than you.
Every strategy follows a clear rule, only uses data that was public on the day, and is recomputed daily after the close, with trading costs.
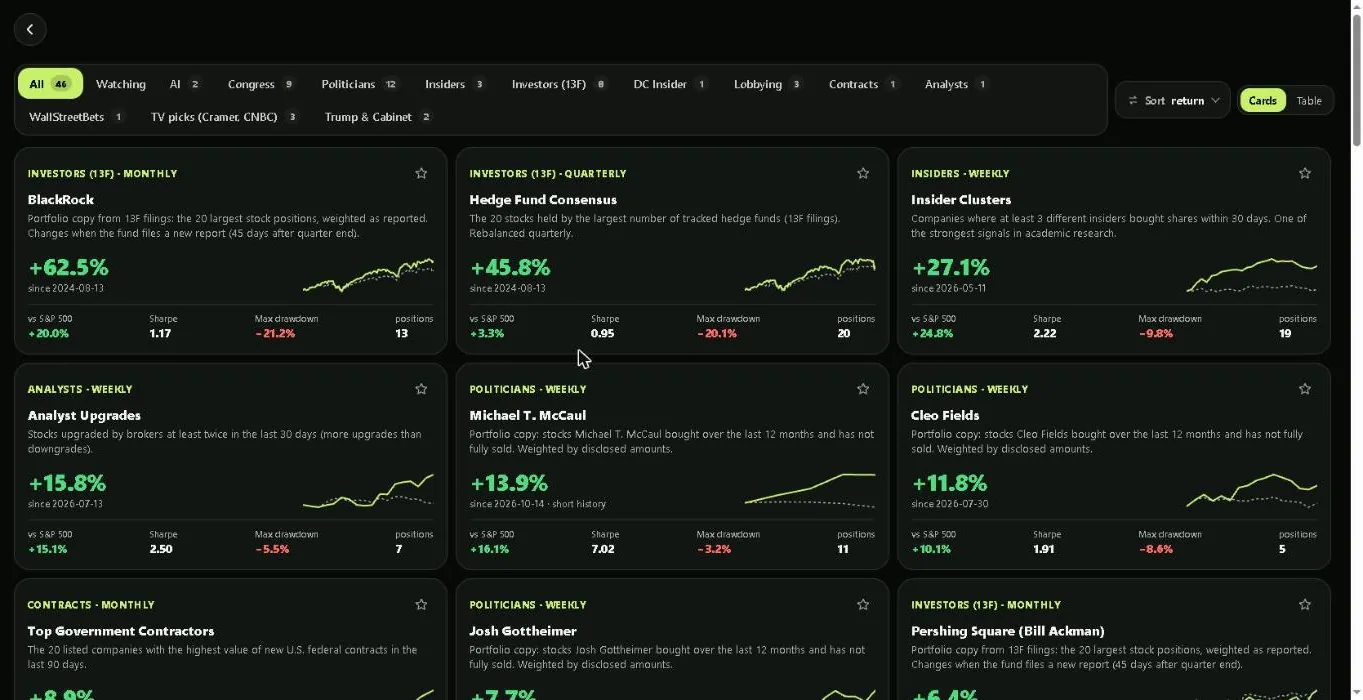
Six families. Dozens of portfolios.
Monthly-retrained models that combine every signal into one forecast.
Long-short, chamber strategies, committee copies and individual politicians.
Inverse Cramer, Cramer Picks, CNBC Final Trades and the Trump Portfolio.
Insider clusters, famous investors, fund consensus, lobbying, contracts and DC Insider.
The scoreboard. Real backtests.
| Strategy | Return | S&P 500 | Sharpe | Max drawdown | Since | Live since publication |
|---|---|---|---|---|---|---|
| Congress Long-Short | +1.1% | +1.7% | 0.31 | −8.4% | 2026-07-20 | – |
| Insider Clusters | +27.1% | +2.3% | 2.22 | −9.8% | 2026-05-11 | – |
| Hedge Fund Consensus | +45.8% | +42.5% | 0.95 | −20.1% | 2024-08-13 | – |
| AI Multi-Signal | −12.9% | +4.3% | -0.92 | −34.0% | 2026-06-10 | – |
| Analyst Upgrades | +12.1% | −2.1% | 1.83 | −5.5% | 2026-07-13 | −3.4% since 2026-11-13, max drawdown −3.4% |
| Government Contracts | +8.9% | −0.9% | 2.66 | −6.0% | 2026-09-01 | – |
Updated 2026-11-09. Simulated on historical data with 0.1% costs per trade, before taxes; returns are cumulative since the start date. The live column starts on the day the strategy was published and is never recalculated, with the same 0.1% costs. Past results do not predict future ones.
From signal to equity curve.
- 1A clear rule
For example: long what Congress bought in the last 30 days, short what it sold.
- 2No look-ahead
Positions open only after the data was public, never on the transaction date.
- 3Measured
Return, CAGR, Sharpe, drawdown and the S&P 500 on one chart.
- 4Followed
Star a strategy to get a push before every rebalance.
Pick one. Read the rules.
A model retrained every month on history combines Congress buys, insider purchases, analyst ratings, government contracts, WallStreetBets and momentum, predicts the next month and buys the top 20 stocks. A long-short version also shorts the 15 worst.
Congress Long-ShortBuys the stocks members of Congress bought in the last 30 days and shorts the ones they sold. Market-neutral. Also in the app: Senate and House versions, committee copies and individual politicians.
Inverse CramerShort the stocks Jim Cramer tells viewers to buy and buy the ones he says to avoid. The “Cramer Picks” strategy does the opposite, so you can compare who wins.
Trump PortfolioCopies the stocks President Donald Trump buys, from his OGE 278-T reports. Positions open only on the day each report is published, never on the trade date.
Copy Buffett & BurryTrack sector rotations, institutional crowding and the exact holdings of top funds (Buffett, Burry, Ackman, Marks) from the day they file with the SEC. Institutional Consensus shows the most bought and sold tickers across every tracked fund at once.
Upcoming TradesFor every strategy Bourse shows what it will buy and sell at the next rebalance, based on data already public today. Star a strategy and you get a push when the list changes and before it trades.
About backtests. Plainly.
Are these real returns?
They are simulations on historical data, before taxes, with 0.1% trading costs. Past performance does not guarantee future results and nothing here is investment advice.
Can I see the current holdings?
Yes, in the app: holdings, the trade history and the trades planned for the next rebalance.
Compare them all. In one screen.
Bourse provides financial data and editorial information, parts of which are generated by AI. This page is for general education only. It is not personalised investment advice or a recommendation to buy or sell any financial instrument. Make your own decisions.