

No single filing type wins every year. Congress buys, insider purchases, analyst upgrades, new federal contracts, WallStreetBets attention and price momentum each carry a little information. The model weighs all nine signals together and lets the data decide how much each one matters.
AI strategies.
Every signal, one forecast.
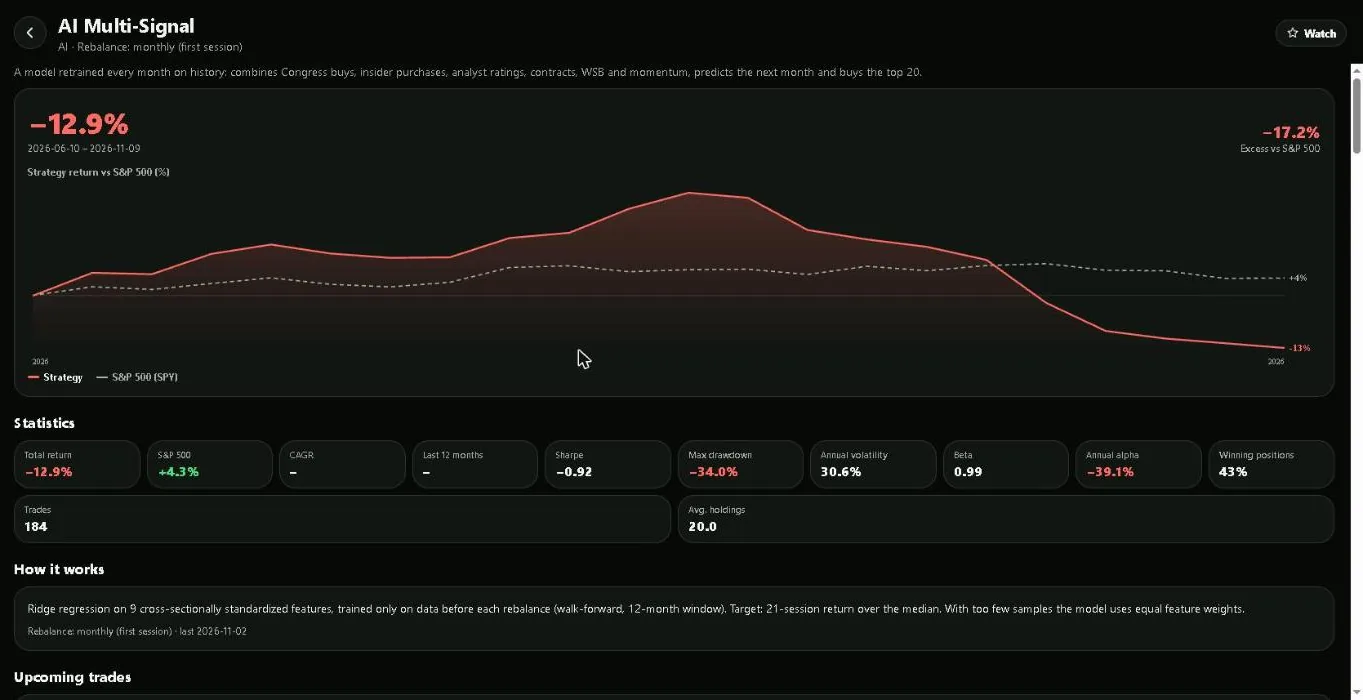
A model retrained every month on history combines Congress buys, insider purchases, analyst ratings, government contracts, WallStreetBets and momentum, predicts the next month and buys the top 20 stocks. A long-short version also shorts the 15 worst.
Why combine signals? And when it fails.
Each month the model is refit only on the 12 months that were known at that time, then it ranks every stock for the month ahead. That walk-forward loop is what you see in the backtest: no future data leaks into a past decision.
A linear model can lag when the market regime changes quickly, and a short history means few training months. The live record is shown as it is, including the months the model lost to the S&P 500.
Under the hood. Nine signals, one model.
- Model
- Ridge regression on nine signals, standardized across all stocks every month.
- Signals
- Congress buys, insider purchases, analyst rating changes, federal contracts, WallStreetBets attention and price momentum, among others.
- Training
- Walk-forward: refit every month on the 12 months before, never on the month it predicts.
- Target
- The 21-session return above the median stock.
- Portfolio
- The 20 highest-ranked stocks. The long-short version also shorts the 15 lowest-ranked.
- Rebalance
- Monthly, with 0.1% costs per trade.
The record. Losses included.
| Strategy | Return | S&P 500 | Sharpe | Max drawdown | Since | Live since publication |
|---|---|---|---|---|---|---|
| AI Multi-Signal | −12.9% | +4.3% | -0.92 | −34.0% | 2026-06-10 | – |
| AI Long-Short | −11.9% | +4.3% | -0.50 | −31.0% | 2026-06-10 | – |
Updated 2026-11-09. Simulated on historical data with 0.1% costs per trade, before taxes; returns are cumulative since the start date. The live column starts on the day the strategy was published and is never recalculated, with the same 0.1% costs. Past results do not predict future ones.
One month of the loop.
On the last session of the month, every signal is computed for every stock from data public that day.
The model is refit on the 12 months before, so it never sees the month it is about to predict.
Each stock gets a predicted excess return and the top of the list goes into the portfolio.
A month later the loop runs again on fresh data. The backtest replays exactly this loop.
About the model. Answered.
Why does the AI strategy sometimes lose to the S&P 500?
Because no signal works every month and the model only learns from the last twelve. The backtest shows those months instead of hiding them, and the numbers on this page are the current record.
Is it a black box?
No. It is a linear model, so every signal has a weight you can read. That makes it less flexible than deep learning but easy to audit and hard to overfit.
Multi-Signal or Long-Short?
Multi-Signal only buys the top-ranked stocks. Long-Short also shorts the lowest-ranked ones, so it depends less on where the market goes and more on whether the ranking is right.
Other strategies. Simpler rules.
All Strategies
Every strategy follows a clear rule, only uses data that was public on the day, and is recomputed daily after the close, with trading costs.
All Datasets44 datasets built from official filings and public sources, cleaned, matched to listed companies and updated around the clock. Through the API: 57 datasets.
RadarOne live feed for Congress trades, insider buys and sells, institutional filings and market signals - filtered, explained and pushed to your phone.
Let the data vote. Every month.
Bourse provides financial data and editorial information, parts of which are generated by AI. This page is for general education only. It is not personalised investment advice or a recommendation to buy or sell any financial instrument. Make your own decisions.