

The complete Bourse guide.
Every screen of the app, on real screenshots of the web version: what it shows, what it is for and the three things to do first. Read it top to bottom or jump to a screen.
The Radar
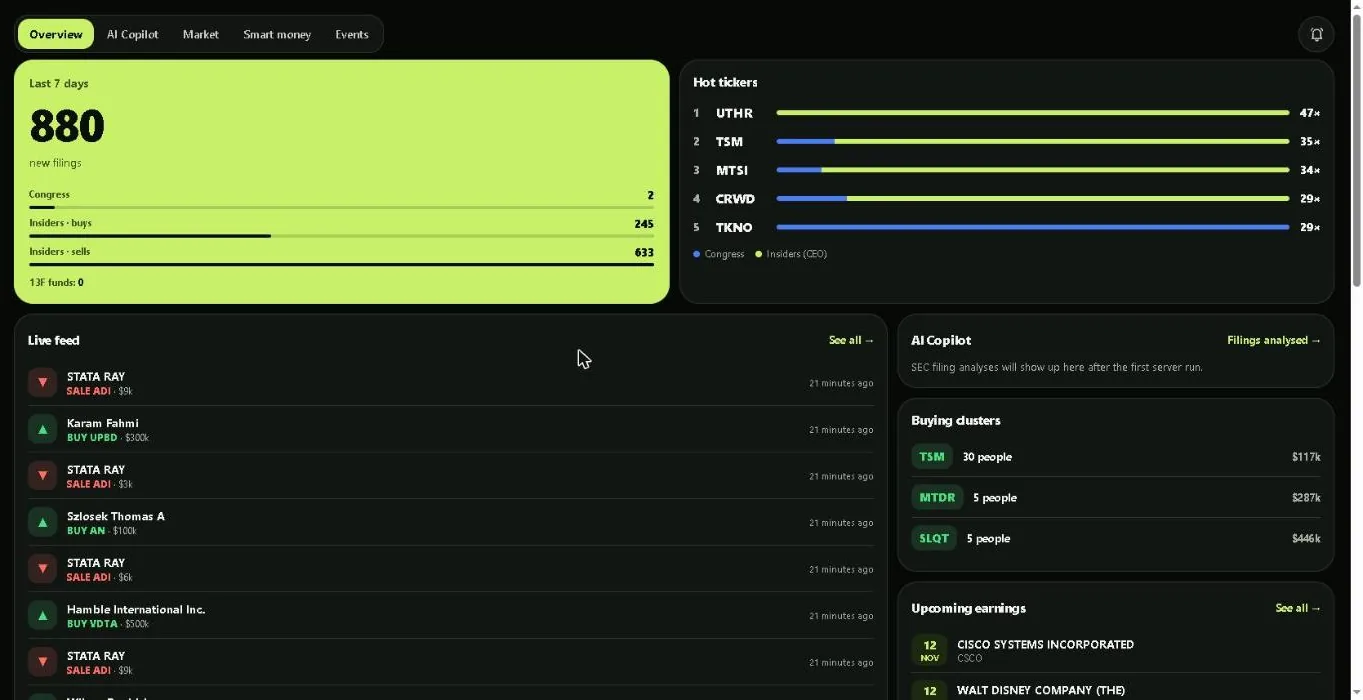
Your home screen. The green panel counts new filings from the last seven days by type: Congress trades, insider buys and sells, 13F funds. Hot tickers ranks the companies with the most activity, and the Live feed lists every new filing with the person, the company, the size and how long ago it landed.
- Click any row to open the company with its chart and every filing.
- Buying clusters lists companies where three or more insiders bought within 14 days.
- Upcoming earnings sits on the right so you see reports before they move the stock.
Datasets
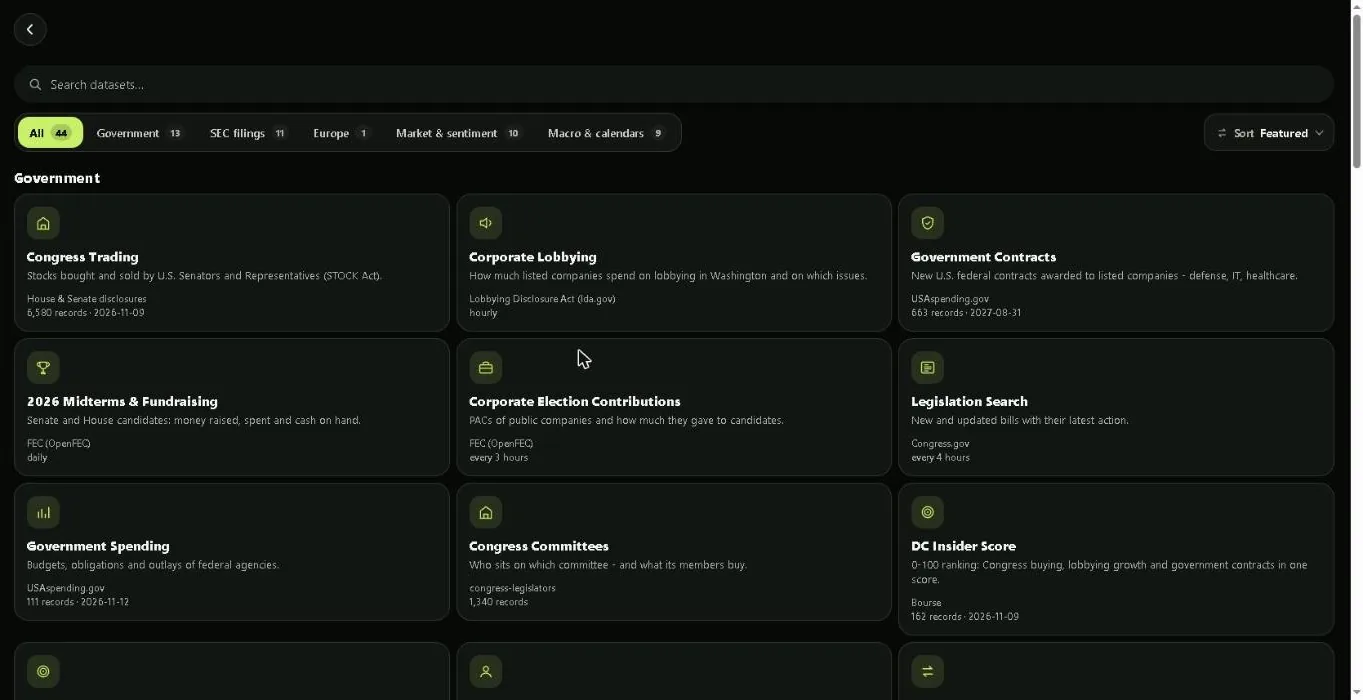
Every source Bourse collects, grouped as Government, SEC filings, Europe, Market and sentiment, and Macro and calendars. Each tile shows where the data comes from, how many records there are and when it was last updated.
- Use the search box to find a dataset by name, ticker or topic.
- Open a dataset to filter, sort and export it as CSV.
- The same data is available in the API: every tile has an endpoint in the docs.
Strategies
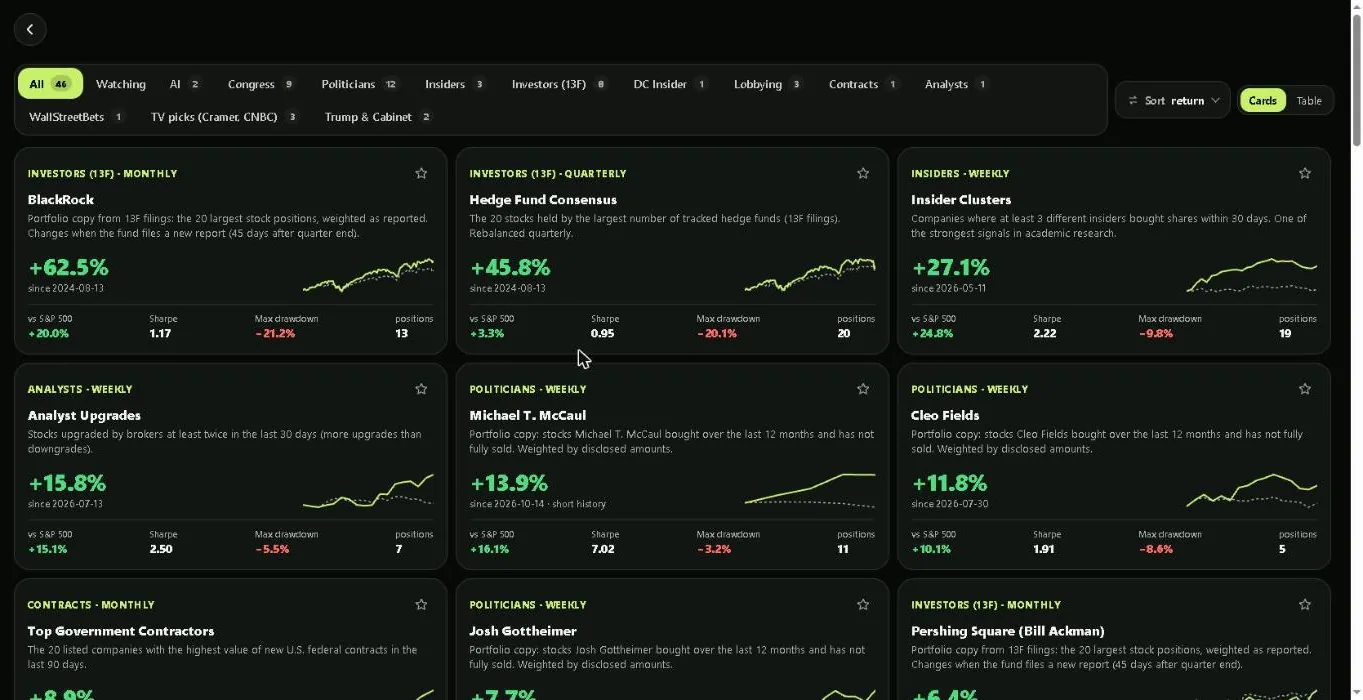
Backtested portfolios built from public filings: Congress members, insiders, 13F funds, lobbying, contracts, analysts, TV picks and AI models. Each card shows the return since the start, the excess over the S&P 500, the Sharpe ratio, the maximum drawdown and the number of positions.
- Filter by category at the top or switch to the table view.
- Star a strategy to watch it and get alerts before each rebalance.
- Every position opens on the day the data became public, never earlier.
A strategy, up close
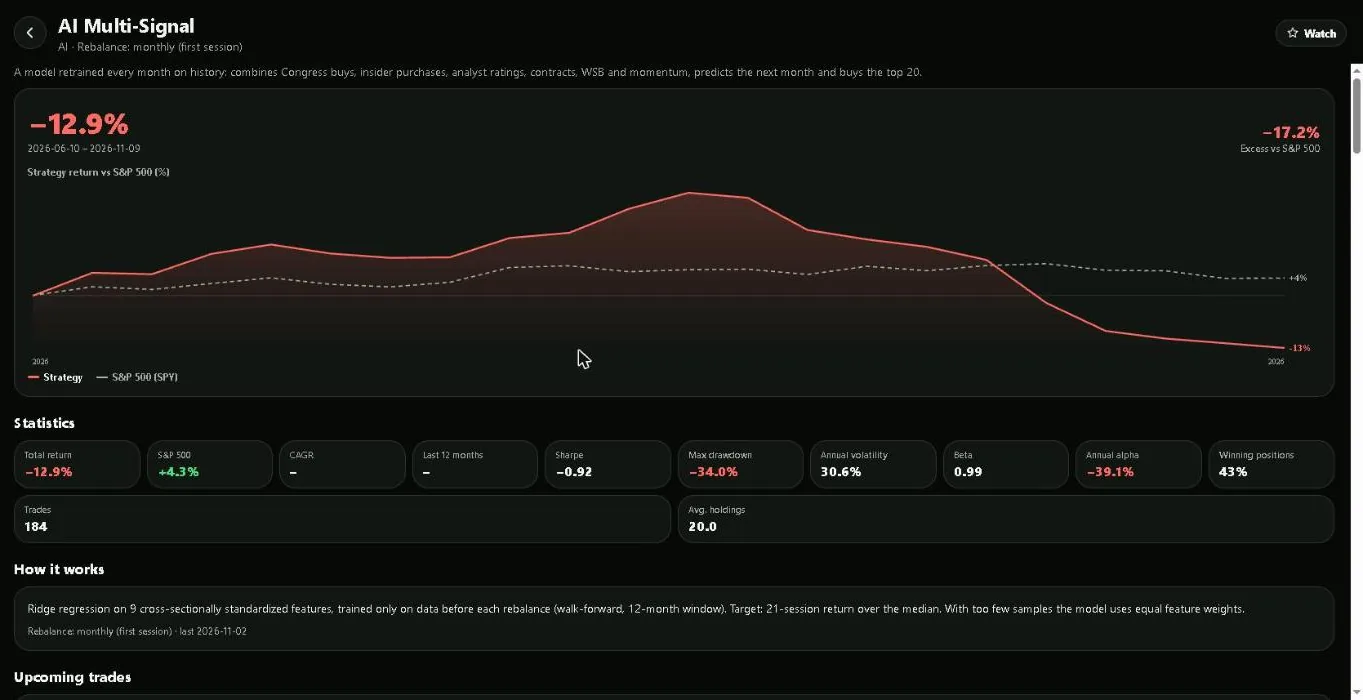
Open any strategy to see its equity curve against the S&P 500, a full statistics row (return, CAGR, Sharpe, drawdown, volatility, beta, alpha, win rate), how it works, its current holdings and the trades of the next rebalance. Losing strategies are shown exactly as they performed.
- Compare the dashed S&P 500 line with the strategy line before trusting any number.
- Upcoming trades shows what the next rebalance will buy and sell.
- Premium unlocks holdings and trades; the backtest is free.
Conviction Score
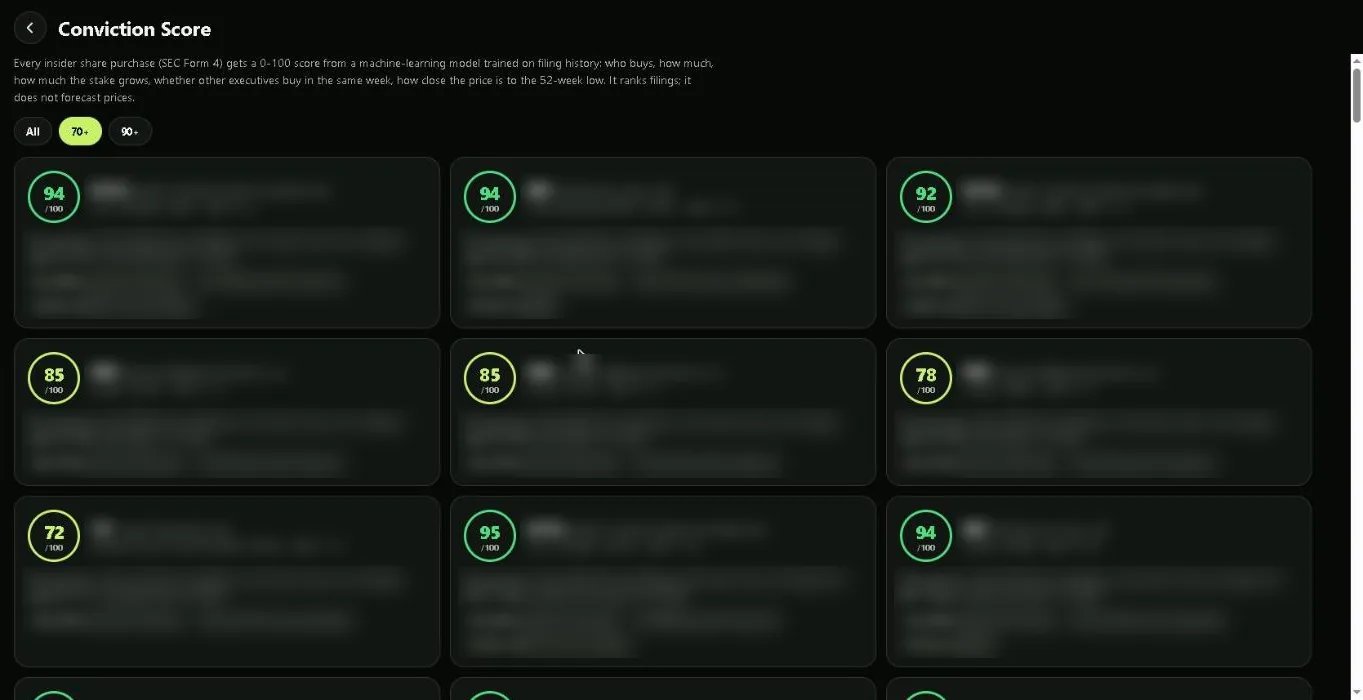
Every insider purchase gets a score from 0 to 100 from a machine-learning model trained on filing history: who bought, how much, how much the stake grew, whether other executives bought the same week and how close the price is to its 52-week low. Each card explains the score in plain words. (Fresh scores are blurred in this screenshot; they are part of Premium.)
- Use the 70+ and 90+ filters to see only the strongest purchases.
- The sentence on each card tells you since when this is the strongest signal on the company.
- The score ranks filings; it is not a price forecast.
Coincidence Tracker
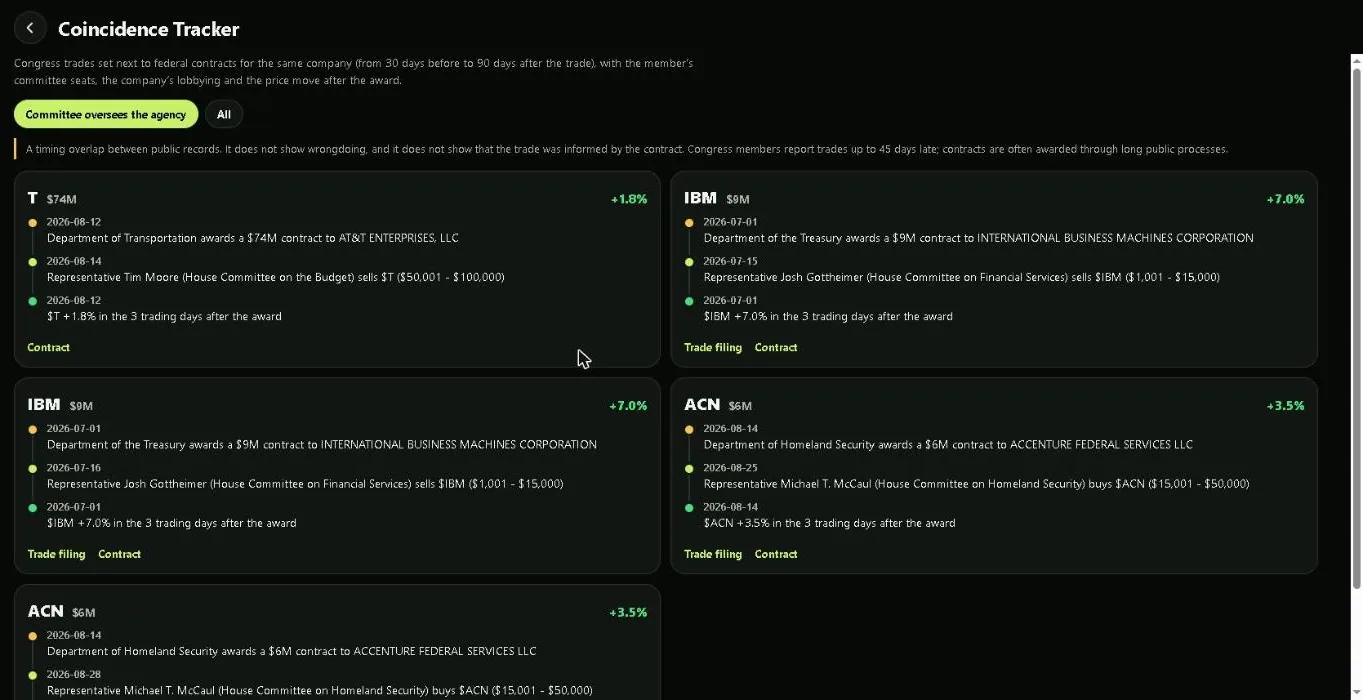
Congress trades set next to federal contracts for the same company, from 30 days before to 90 days after the trade, with the member’s committee seats and the price move after the award. The default view shows only cases where the member sits on a committee that oversees the awarding agency.
- Each card links to the original trade filing and the contract.
- Switch to All to see every overlap, not only committee oversight.
- An overlap in time is not proof of anything; read the note at the top.
1-Click Insights
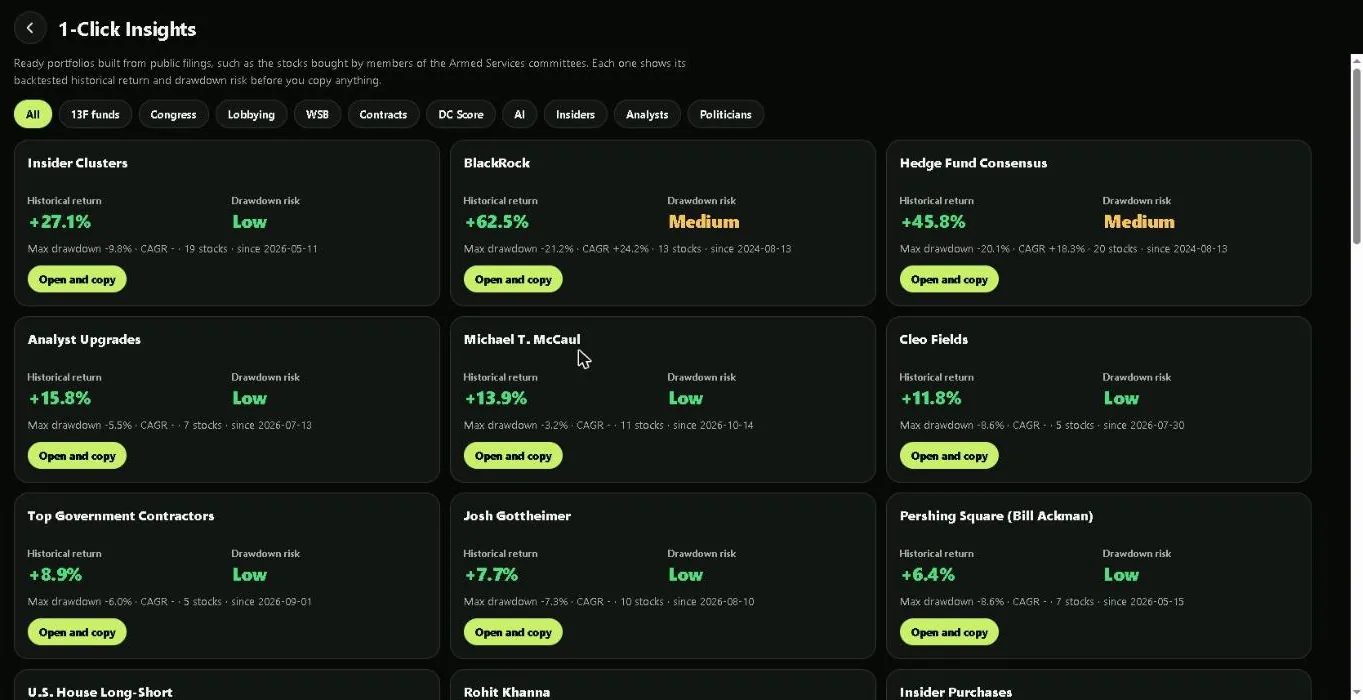
Ready portfolios built from public filings, such as the stocks bought by the Armed Services committees or the consensus of hedge funds. Every card shows the historical return and a drawdown risk label before you copy anything.
- Open and copy opens the strategy with its holdings, so you can follow it and get its alerts.
- Drawdown risk is Low, Medium or High from the worst historical fall.
- Filter by source: 13F funds, Congress, lobbying, contracts and more.
Alerts and the watchlist
Add tickers to your watchlist and Bourse sends a push when one of them moves 3% or more, when a politician or insider trades it, or when a line you drew on the chart is crossed. Premium adds alerts on specific politicians.
The API panel
Settings → API key creates your key, shows today’s usage and, on Pay-as-you-go, the cost of the month so far. API Pro holders can create up to 10 keys and add webhooks there.
Web, Android and Windows
The same account works in the browser at bourse.pl, in the Android app from Google Play and in the Windows app. Your watchlist, alerts and strategies follow you between them.
Bourse provides financial data and editorial information, parts of which are generated by AI. This page is for general education only. It is not personalised investment advice or a recommendation to buy or sell any financial instrument. Make your own decisions.